People often ask how variable mortgage rates compare to fixed rates over time. Here’s a chart that illustrates their relationship over the last 10 years. (click to enlarge)
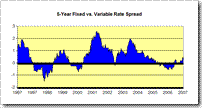
This graph shows the spread between fixed and variable rates since 1997 (the “spread” = the average fixed rate – the average variable rate).
The higher the spread, the more expensive a fixed-rate mortgage was compared to a variable at that time.
Despite a limited sample size, the chart is consistent with the common belief (and research) that variable rates are the better bet long-term. In fact, since 1997 variable rates have been almost 1/2% cheaper than fixed rates on average.
(The average fixed rate since 1997 has been 5.47%. The average variable rate has been 4.99%.)
While the future may deviate from the past, it’s reasonable to assume a “safety” premium will remain built into fixed-rate mortgages. If you don’t need this protection (and most don’t assuming they have a hold-the-payment option) then strongly consider the potential savings of a variable rate.
___________________________________________________
Note: The Bank of Canada (our data source) doesn’t database actual market rates. Therefore we’ve made two assumptions. For the variable rate we’ve assumed a 0.5% discount from prime rate. For the fixed rate we’ve assumed a 1.5% discount from posted bank rates. While not scientific, these assumptions are in the ballpark.

I just find the trouble with this is that historically the average rate for 5 year posted rates I believe was somewhere near 10% since the 70’s. I don’t have the facts in front of me so I won’t quote exact figures. This puts me in the position of thinking that if the 25 year rate is less than about 8% you may be better off just locking in for huge periods of time. I haven’t sate down with a rolling 25 year period to see if it really works, but I’m willing to bet it works out fairly well.
My only real proof of this is that banks seem to REALLY push variable rates when rates are low. You see their ads all over the place for variable rates when rates are lowest, assuming that this is the most profitable product for them at the time (since when rates are low, it’s likely they will go up) the banks are always serving their best interest.
I would be willing to bet if you could score yourself a less than 6% locked in 25 year rate, you’d be smooth sailing for an awful long time. Currently you could probably get between 6-7% over that period. That historically is still a really low rate. Sure there may be a few periods where your variable rates win, but what happens when the rates go crazy like in the 80’s and you’re still smooth sailing on your 6.5%? All the variable folks in their 18% homes will be dropping like flies.
Lets say on a 250000 home with a 200000 mortgage over 25 years. With a 6.5% 25 year rate your payment will be 1,339.65. The variable payment will be 1,209.17. That’s a pretty big difference. But what happens when in 10 years some rogue terrorist unit destroys some great US landmarks and some famous world leader gets assassinated and WWIII starts or there is some ‘resource crisis’? Then rates go crazy and skyrocket to 18% on variable rates.
The 25 year guy will be paying 1,339.65 and the variable guy having a balance of 149,532.04 and 15 years to go will jump to $2,339.55.
I realize it’s a pretty negative view of how the world works. That’s why there are different products and different people take on different risks. I don’t like taking chances on my home though. In my view the Central Bank is built to protect bank profits and Banks sole purpose is to make profits. They will do whatever it takes in the long run to make sure their profits stay protected no matter what they do to Mr. Median.
Hi Traciatim,
Thanks for the viewpoint. A lot of people share your belief, which is partly why 7 out of 10 people still choose fixed rates.
However, a lot has changed in the last 25 years. Most importantly, in 1991 the Bank of Canada launched it’s 2% inflation target, which is now a permament fixture of our economy. It is highly probably that the BoC will continue doing everything within its power to keep inflation in check. Our economic growth and people on fixed budgets depend on it. Low inflation = low interest rates–most of the time.
That said, there are those (like Benjamin Tal) who do expect a bump in inflation a year from now. If he’s right, it’s conceivable that rates could pop a bit in the next 12-24 months.
Over time, however, things will likely smooth out and the “security premium” built into fixed rates will end up costing homeowners more in the long-run.
Just food for thought…
Cheers,
Rob
For those curious, here’s an overview of the Bank of Canada’s inflation target policy…
Hi Traciatim,
The real things you should be concerned about are:
1.Natural Gas prices (heating)
2.Property Taxes
3.Engery prices in general
The interest rates are not going to go up any time soon. High interest rates will slow the economy down. Review the sub-prime mess in the US.
Rob, CIBC’s forcast for 2008 is interest rate cuts in Canada and the US. The high energy costs will act as the speed bump for the economy. (plus the property taxes which go up every year)
Oil man T.Boone Pickens (yes that is his real name!) Back in 2004 when oil prices were $35 a barrel was calling for $50. People thought he was crazy. If oil remains at $90 plus, gas prices in the summer at $1.20 per liter will look like a boxing day deal! Look for new all time highs! Just my thoughts, I could be wrong.
regards,
Brian
Hi Brian,
I should clarify. Benjamin Tal (CIBC’s Chief Economist) expects rates could jump after 12 months or so, not “within” 12 months. This was from his recent speech at the CAAMP conference in Toronto.
Cheers,
Rob
Hi Rob,
Good point. If rates go up after 12 months and perhaps a cut before… go variable any way!
The big deal will be Oil prices, Nat. gas prices. If someone wants to save money get their house energy efficient don’t worry about rates going through the roof worry about heat going through the roof!
Happy New Year!
Brian
I have had my variable mortgage for over 5 years now. 3.25% when I first received it. I had the option of a fixed 4.08% for 4 years. Now the 3.25% is up to 5.25% (5.5% before the dip in December 2007). I used the strategy to treat the 3.25% monthly payments as 5% payments to hedge against an increase, hence paying down more on my principal. When the time came to re-new my mortgage, the final payout on my mortgage (estimated on my initial document from the bank) was much higher then what I actually re-newed for. I tossed the 4.08% for 4 years into a mortgage calculator for fun to see the difference……quite happy with the end result. Big Fan of a variable mortgage as you can tell :)
This has been the subject of great debate between my friends and I as well.
My personal view on the fixed rate mortgage is you are essentially entering an agreement to hedge out or elminate the interest rate uncertainty associated with your mortgage payments. In this way you are better able to understand and plan what the future expenditures are associated with your mortgage are.
To some risk averse individuals, like myself, elminating this uncertainty is valuable and gives me peace of mind at night. I guess other share this view hence why fixed rate mortgages continue to be popular (7-10) choose fixed rate mortages as quoted from above.
Thanks
Rohit
Hi Rohit,
Thanks for the note. Your point about payment predicability is the #1 reason people seem to choose fixed-rate mortgages. Unfortunately it keeps a lot of people from benefiting from the potential interest savings of a variable rate.
Fortunately there’s a solution. If you’re worried about payments changing there are lenders that offer a hold-the-payment feature. That way, if prime rate goes up, your payment doesn’t.
The only exception is if prime rate goes up so much that your payments don’t cover the interest due. Then your payment will adjust accordingly. (But the odds of that occuring are somewhat low in a 5-year term.)
Of course, another solution is for lock into a fixed rate if you want to set your payment. You can generally do this at any time without penalty.
Have a great weekend,
Rob
I’m purchasing a new home soon, I could get a fixed rate of 5.15% for 5 years or variable at 4%.
If I am betting man, which I am, the 4% seems very interesting and the moment the fixed rate goes under 4.9% I will lock it in for 5 years.
Your thoughts ?
That sounds like a fine plan Steve, what’s your plan for when the rates spike by 6% the next year or 2 when the Liberals bring in their carbon tax and the price of everything spikes making the Bank of Canada react in the exact opposite way that it did to the Conservative GST cut, but raising rates drastically. Remember, always hope for the best and plan for the worst.
The worst case scenario I am going to wait till the US elections.. Once october – november rolls in I plan to lock it in to a fixed rate…
Hi Steve: Timing interest rate turns is so incredibly difficult for most people. Here’s a link that partly explains why: Predicting Mortgage Rates. Fortunately you’re a betting man so you can probably handle the risk. Keep in mind that, depending on your lender, their fixed rate and variable-to-fixed-conversion rate might be different (with the latter being higher).
Hi Traciatim: Good advice…on planning for the worst that is.
I disagree with one statement from all the above info:
Banks always have their own interest in mind.
This is not always the case. I have been a mortgage broker for many years and decided to take it easy for a while and work for the bank. I do not push prodcuts on people that they do not want. I only provide the rates and options available and allow the client to decide. I will give my opinion but leave the final call up to the client. This way the client does not feel pressured. No pressure ususally ends up with a happy client. A happy client almost always ends up pasing over their friends and family – and this is what serves me well working for the bank. Just a thought to consider – not all bankers sell what the bank wants us to sell. I sell what my clients ask for and point out benefits of all products.
Thanks – from your mortgage banker since 1997 (yeah i know – not a very long time – but i am only 27 – so almost half my life doing mortgages)
Kev
I don’t mean to be rude but how good can your opinion be if you are only selling one banks products? Surely there are lenders with better mortgages than your bank in a large number of cases. How can most of your clients really be happy in that case? Are you saying that you sell products that your bank does not “want you to sell?” (Better keep your resume up to date!)
I’m not trying to be argumentative, just trying to keep it real.
KK