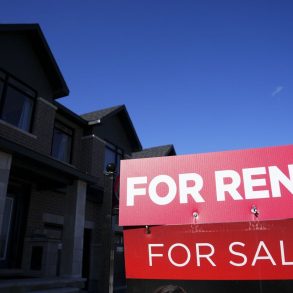
Both home prices and sales continued to trend downward in November as high interest rates continued to keep many prospective buyers on the sidelines.
The national average home price fell 1.6% from October to $656,625, according to figures released today by the Canadian Real Estate Association (CREA).
That’s still 2% above year-ago prices, but now more than 20% below the peak reached in February 2022. The national Home Price Index, which adjusts for seasonality, was down 1.1% month-over-month.

Sales were also down across the country, dipping another 0.9% in November following a 5.8% decline in October. The steepest drops in activity were seen in Manitoba (-9.7% month-over-month), B.C. (-5.5%) and Quebec (-2.2%).
“Even with rates falling last month, they were still at elevated levels, which was enough to weigh down housing sales,” said TD’s Rishi Sondhi.
Sales are now down 18% from their pre-pandemic levels.
“Demand has indeed collapsed from the low-rate frenzy of 2021 and early 2022, but demographic demand is keeping activity from falling much further,” wrote BMO’s Robert Kavcic.
New listings also continued to drop, falling another 1.8% in November following a 2.2% drop in October. That contributed to the sales-to-new listings ratio rising slightly to 49.8%, though it remains well below its 10-year average of 61%.
Affordability still deteriorating
Despite some minor rate relief seen in recent weeks, overall housing affordability remains at its worst level in decades.
“Canadian housing affordability is currently the worst it has been since the 1980s, as exuberant price gains were subsequently met by a surge in mortgage rates,” said Kavcic. “Since the peak, lower prices have been offset by higher borrowing costs from an affordability perspective, yielding no relief.”
In the third quarter, National Bank reported a “significant deterioration” in housing affordability, noting that every single market experienced an increase in their mortgage payment as a percentage of income measure.
On average, buyers in the country’s 10 largest urban markets would need more than six years (75 months) to save up the minimum down payment for their home purchase. That’s nearly double the 41.1-month average since 2000. This is based on a 10% savings rate of the median pre-tax household income.

But with the Bank of Canada presumably finished its rate-hiking and fixed mortgage rates starting to fall, could relief be around the corner?
“As the cycle turns and rate cuts eventually meet these lower prices, affordability should benefit. Somewhat,” says Kavcic. “The level is still a long way from where it was before the pandemic.”
And while prices are expected to remain under pressure for the short term, that could turn around early in the new year.
“The combination of pent-up demand and easing borrowing costs could finally put a floor under the market,” he added. “At the same time, market psychology will surely improve given that we have a clearer view of what the worst-case borrowing-cost conditions look like…That said, the path back to the 2022 price peak will be a long one in Ontario (think years, not months).”
Cross-country roundup of home prices
Here’s a look at select provincial and municipal average house prices as of November.
| Location | November 2022 | November 2023 | Annual price change |
| B.C. | $904,793 | $964,371 | +6.6% |
| Ontario | $828,608 | $833,525 | +0.6% |
| Quebec | $467,164 | $485,407 | +3.9% |
| Alberta | $422,032 | $446,919 | +5.9% |
| Manitoba | $330,742 | $328,564 | -0.7% |
| New Brunswick | $268,700 | $287,900 | +7.1% |
| Greater Vancouver | $1,129,300 | $1,185,100 | +4.9% |
| Greater Toronto | $1,080,000 | $1,081,300 | +0.1% |
| Victoria | $859,200 | $869,500 | +1.2% |
| Barrie & District | $776,900 | $781,300 | +0.6% |
| Ottawa | $620,200 | $628,900 | +1.4% |
| Calgary | $504,600 | $557,400 | +10.5% |
| Greater Montreal | $495,900 | $514,300 | +3.7% |
| Halifax-Dartmouth | $482,000 | $509,300 | +5.7% |
| Saskatoon | $361,600 | $380,000 | +5.1% |
| Edmonton | $363,300 | $368,200 | +1.3% |
| Winnipeg | $329,600 | $332,700 | +0.9% |
| St. John’s | $323,000 | $335,400 | +3.8% |
*Some of the movements in the table above may be somewhat misleading since average prices simply take the total dollar value of sales in a month and divide it by the total number of units sold. The MLS Home Price Index, on the other hand, accounts for differences in house type and size and adjusts for seasonality.